Home / Statistical Tools / MSA / Nested ANOVA
Nested ANOVA Method
From Excel click...
QXL Stat Tools Tab > MSA (Gage R&R) > Nested ANOVA Method
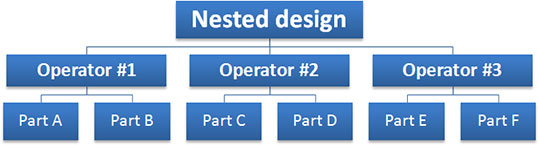
Nested ANOVA analysis should be used when operators are unable to measure the same parts. Parts are nested within operators.
An example of nested design are destructive studies. In destructive studies the part is destroyed during tests, and the operator can only test them one time. For destructive testing, all parts within a single batch should be identical enough to be considered as the same part.
Quantum XL uses Nested ANOVA to analyze nested design.
Data source
The data source for an ANOVA analysis can be in the form of an MSA Template or stacked data format. Specification limits and reference values are optional. If the specification limits are provided, a Gage Capability Curve will be plotted on the results sheet, and a Gage R&R table will have an additional column, '% Tolerance'.
Note
Reference values are required for the bias and linearity calculation.
Results
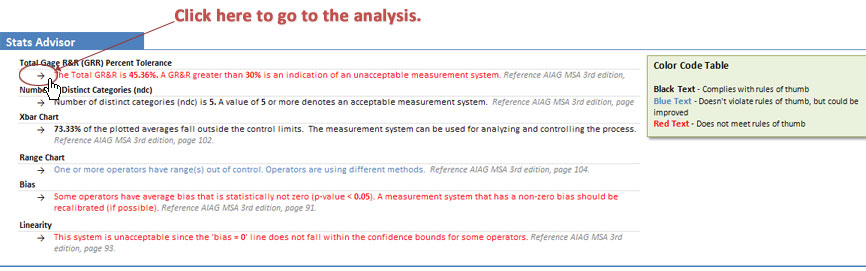
Stats Advisor
The purpose of Stats Advisor is to help users understand numerical and graphical results of the MSA analysis.
Sentences are color coded with black text denoting results that comply with rules of thumb, blue text denoting results that don't violate rules of thumb but could be improved, and red text for the results that do not meet rules of thumb.
Arrows on the left side of the sentences are links to the appropriate analysis result.
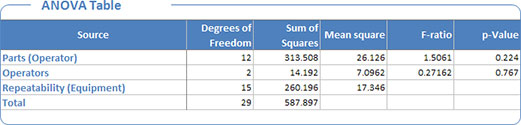
ANOVA table
The ANOVA table displays results from two-way nested ANOVA analysis. This table is used to calculate the variance components.
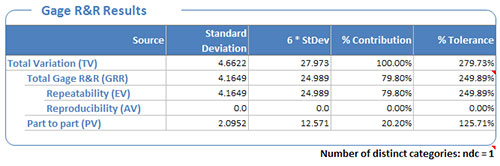
Gage R&R Results table
An MSA estimates how much of the variation lies within the measurement process vs. the parts. The MSA breaks the overall variability statistics which are reported in the Gage R&R Table:
- Equipment Variation (EV) -- Repeatability
-
Operator (appraiser) Variation (AV) -- Reproducibility.
-
Repeatability & Reproducibility (GRR) -- Repeatability is the variation within operators and Reproducibility is the variation between operators.
-
Part Variation (PV) -- The variation of the parts.
Probability of Misclassification
Joint Probabilities
- P(part is good and is rejected) = the probability part is good and will be classified as bad
- P(part is bad and is accepted) = the probability part is bad and will be classified as good
Conditional Probabilities
- P(Bad part is Falsely Accepted) = the probability that a part that is truly bad will be accepted.
- P(Good Part is Falsely Rejected) = the probability that a part that is truly good will be rejected.
P(Part is good)
- The probability that a part is truly in spec. If you had zero measurement variation, this would be your yield.
The conditional probabilities are calculated from Bivariate normal distribution.
Xbar chart
Xbar Chart is used for comparison of operators to each other and to the mean. The measurement system can be used for analyzing and controlling the process if 50% or more of the plotted averages fall outside the control limits.
Range Chart
Range Chart is used for comparison of the operators' variation to each other. If all ranges are in control, then the appraisers are doing the same job. If one or more operators have range(s) out of control, then the operators are using a different method. If all operators have range(s) out of control, the measurement system is sensitive to appraiser technique and should be improved.
Components of Variation Chart
Graphically represents components of variation -- %Contribution and %Tolerance for Gage R&R, Repeatability, Reproducibility and Part to Part variation.
Gage Performance Curve Chart
Plots the probability of accepting/rejecting a part based upon its value. The Gage Performance Curve will only be created if specification limits are provided. If reference values have been provided, the Gage Performance Curve will be offset for the value of the average Bias.
Linearity and Bias section
Quantum XL will include Bias and Linearity analysis at the end of the MSA report, if the reference values have been provided. Bias and Linearity are calculated and reported per operator.