Home / Statistical Tools / Hypothesis Tests / Tests For Mean / Two-way ANOVA Crossed
Two-way ANOVA (crossed)
From Excel click...
QXL Stat Tools Tab > Hypothesis Tests > Tests for Mean > Two-way ANOVA
| Test type: | Mean |
|---|---|
| Data: | Quantitative |
| Number of Variables: | 2 |
| Number of Groups: | 2 or more |
| Assumptions: | Normally distributed samples with equal variance |
Two-way ANOVA is a hypothesis test used to compare means when the data has been classified by two variables (factors).
You can use a Two-way ANOVA (crossed) when the following conditions are met:
-
Samples are independent.
-
Populations are normally distributed.
-
Population variances are equal.
If the data is not normally distributed, use Friedman's test. If the data doesn't have equal variances, consider multiple two-sample t-Tests assuming unequal variance.
There are three sets of hypothesis:
-
The population means of the first factor are equal.
-
The population means of the second factor are equal.
-
There is no interaction between the two factors.
Step #1: Select data source for two-way ANOVA (crossed).
Data for the two-way ANOVA (crossed) can come from an Excel spreadsheet, SQL data source, or it can be entered manually.
See source data formats and example data for the two-way ANOVA.
Step #2: Options.
-
'Decision Criteria' option (default = 0.05). The value of the decision criteria (significance or α level).
-
'Show Box plot' options. Display box plot along with hypothesis results.
-
'Display mode' option. When the 'Verbose (long)' option is on, Quantum XL will display additional text that explains the hypothesis test results.
Example
We tested if there is a difference in web page load time on two different servers. Tests were performed from different geographic locations. Using two-way ANOVA we can find out if load times are different between two servers, does geographic location matters and if there are interaction between geographic location and server.
-
Open two-way ANOVA worksheet.
-
Run Quantum XL > Hypothesis Tests > Tests for Mean > Two-way ANOVA.
-
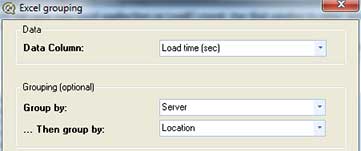
Select 'Group By' data source, and select:
- 'Load time (sec) for Data field
- 'Server' for Group by field
- 'Location' for ...then group by field
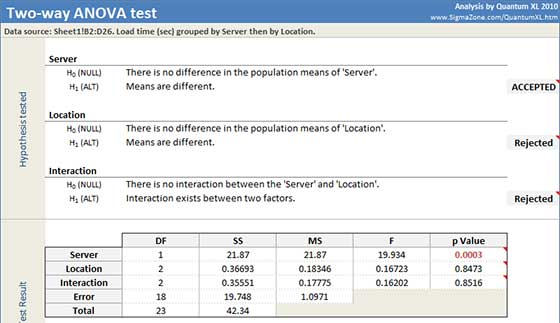
Quantum XL will display the ANOVA table and 95% confidence intervals for the mean. For each hypothesis set, Quantum XL will mark alternative hypothesis as Rejected or Accepted, based on p Value from ANOVA table:
-
Factor 1: p-Value = 0.0003. Since it is less than the decision criteria (0.05), the null hypothesis can be rejected. We can conclude that means are different for Servers.
-
Factor 2: p-Value = 0.8473. Since it is greater than the decision criteria null hypothesis cannot be rejected. We cannot conclude that means are different for Location.
-
Interactions: p-Value = 0.8516. Since it is greater than the decision criteria null hypothesis cannot be rejected. There is not enough evidence to say that there is interaction between geographic location and servers.
Update
Two-way ANOVA is updatable. After you create a two-way ANOVA analysis, you can change its data source or add new data to the data source and simply update the analysis.
-
Update: Quantum XL > Statistical Tools > Update Sheet
-
Change settings: Quantum XL > Statistical Tools > Modify Chart/Analysis