Home / Statistical Tools / Analysis Tools / Time Series / Understanding the Single and Double Exponentially Weighted Moving Average Analysis
Understanding the Single and Double Exponentially Weighted Moving Average Analysis
Single EWMA Calculation
Double EWMA Calculation
Level Weighting
Both the EWMA and Double EWMA use level weighting. The formula for level weighting is below. Note that if alpha = .2, then the ith smoothed data point will be based 20% on the ith data point while the remaining 80% will be based on the last smoothed point. As alpha increases, more and more weight is placed on the data rather than the smoothing. If alpha=1, then the Single EWMA is equivalent to an individuals chart.
Trend Weighting
The Double EWMA uses trend weighting in addition to level weighting. The formula for trend weighting is below. Much like the level weighting, gamma affects how much weight is based on the ith trend vs. the i-1 trend.

The key to understanding the trend is this part of the equation below. This is the difference in the level from i-1 to i. This is analogous to the slope of a line. The larger the difference in the level between i-1 and i, the larger the slope (or trend).
Comparing EWMA and Double EWMA
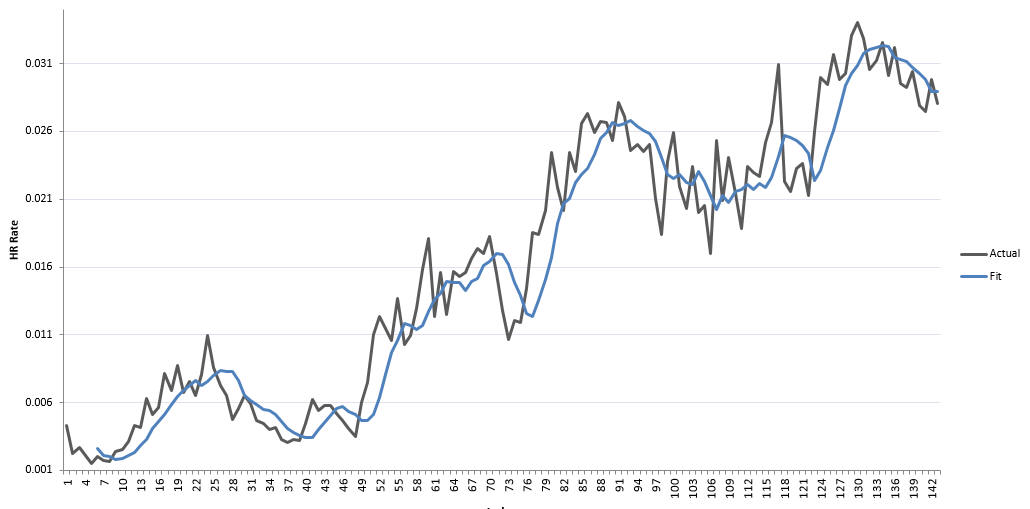
In some cases, data is noisy or has excessive short term variation. The example below uses the Home Run Rate from Major League Baseball. You can download this dataset here. This dataset has the Home Run rate from 1871 to 2013. The Home Run Rate is calculated as the number of home runs divided by the number of at bats.
If we were to smooth this data using a Moving Range Length = 5, the resulting plot would look like the chart below. Note that the dark brown line represents the Actual (unsmoothed) and the blue line represents the smoothed fit. The smoothed fit line doesn't have the localized variation present in the raw data.
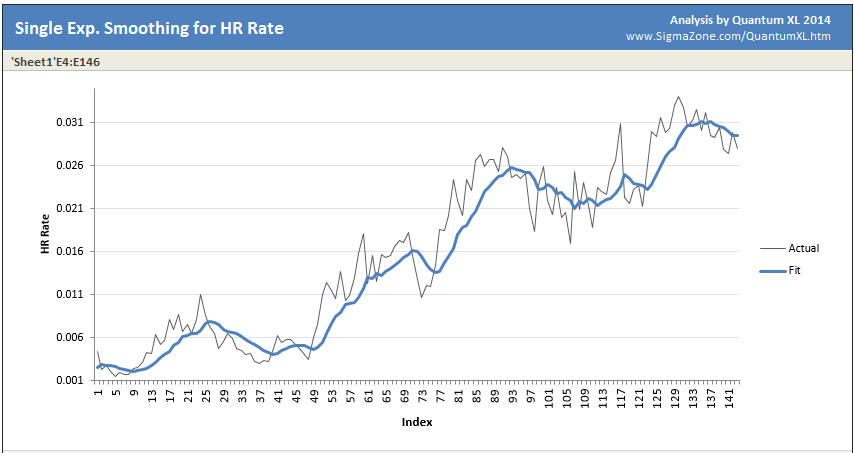
Single EWMA with alpha = .2. The EWMA line is in blue, the raw data is in black.
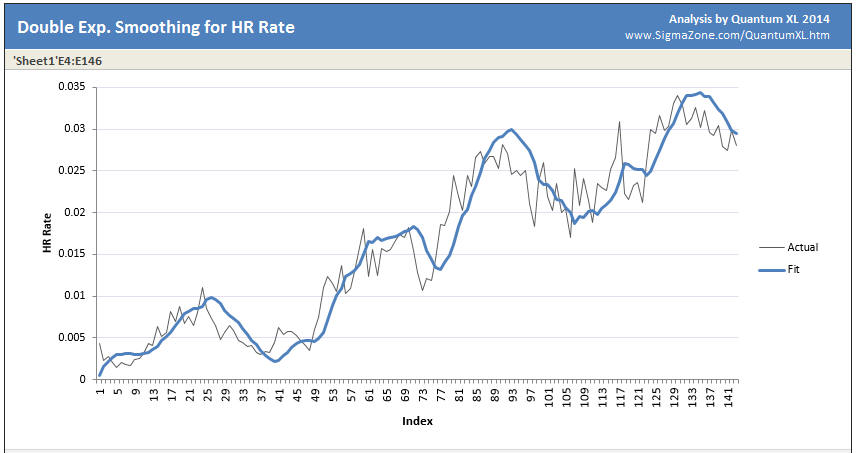
The Double EWMA with alpha = .2 and gamma = .2. The raw data is the thin black line while the Double EWMA line is in blue.
See Also
The data used in the article comes from www.seanlahman.com.