Home / Statistical Tools / Analysis Tools / Johnson Transformation
Johnson Transformation
Menu Command
QXL Stat Tools Tab > Analysis Tools > Johnson Transformation
The Johnson transformation is a transformation to Normality. Quantum XL will analyze a dataset, and provide the optimal Johnson Transformation. For more information see the topic Understanding the Johnson Transformation. For a dataset, the Johnson transformation will find a transformation that will optimize normality. Each data point in the original dataset will have a transformed counterpart. For example, the dataset below, in the original dataset the first point was 1.557. After transformation, that value is transformed into .1667.
The objective of the Johnson Transformation is normality. For example, this is a histogram of the "Original Data".
This is the histogram of the transformed data.
Step #1: Select data source for Analysis.
The data for a Johnson transformation is typically a single column of data. However, if you have more than one column Quantum XL will ask you if you want to treat it as a single dataset or multiple datasets.
Step #2: Press Next or Finish
Quantum XL will calculate Johnson Transformation. There are multiple sections to the report.
Johnson Family and Parameters
The Johnson Family and Transformation Parameters are the first section in the output. For more information see Understanding the Johnson Transformation. The Anderson Darling Best Fit for the Transformed data is just below the Transformation Parameters. The Anderson Darling p-Value should be greater than .1 for the transformation to be considered normal. For more information see the topic on Normality Hypothesis Testing. To the right are areas to transform and inverse transform a single number.
Johnson Transformation Best Fit
When fitting the transformation, every z-value from .25 to 1.25 in increments of .01 is fit to the data. The graph below represents the Anderson Darling p-value vs. the z-value, where higher p-values are indications of better normality.
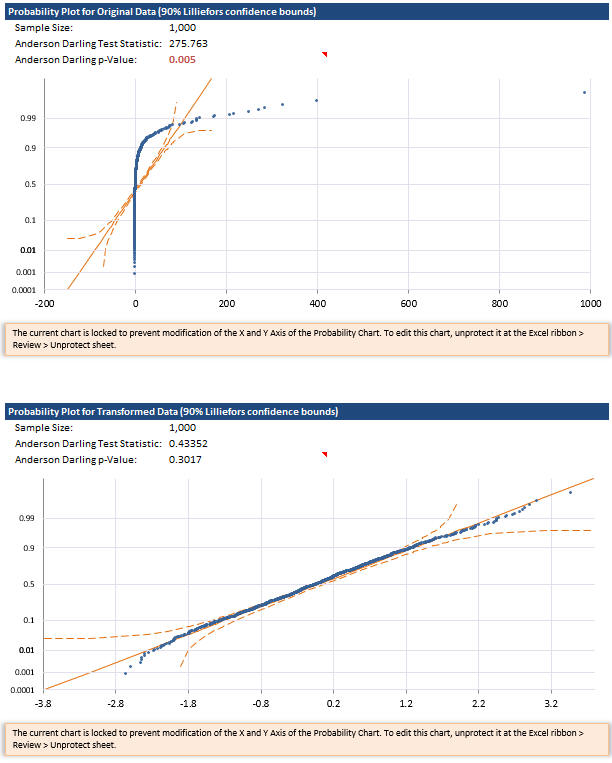
Probability Plot Original and Transformed Data
The probability plot of the data before and after transformation can help you decide if the transformation was useful. If the data falls into a straight line, then it is an indication that the data is normal. Note the strong curve in the original data probability plot while the transformed data is better behaved.
Original and Transformed Data
Finally, the original and transformed data is supplied in table form.