Home / DOE / Charts / Pareto of Regression Coefficients
Pareto of Regression Coefficients
From Excel click...
QXL DOE Tab > Charts > Pareto of Regression Coefficients
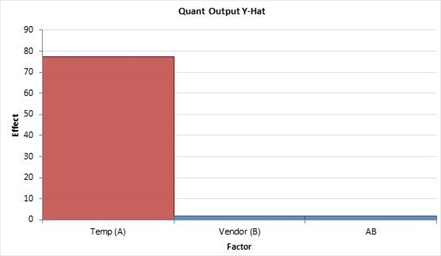
You can create a Pareto of Regression coefficients from a regression table by selecting QXL DOE Tab > Charts > Pareto of Regression Coefficients.
The Pareto will plot the absolute value of the coefficients sorted in descending order. The color of the bar will match the color of the p-value from the model. P-values less than .05 are red, p-values between .05 and .1 are blue, and p-values greater than .1 are black.