Home / DOE / Additional Information / S-Hat Model
S-Hat Model
Quantum XL will automatically build an S-hat model when the output is Quantitative and there are sufficient observations.
Quantum XL will calculate the standard deviation for each unique covariate pattern and use these points to build an S-hat model.
Simple Example
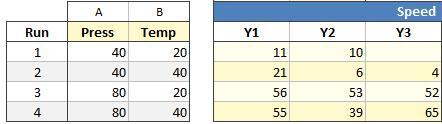
In the design below, the 2² Full Factorial is replicated three times. This design has four unique covariate patterns, one each in Runs 1, 2, 3 and 4.
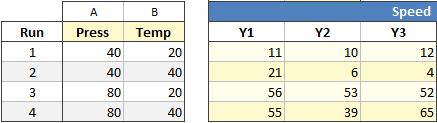
Quantum XL will calculate the standard deviation for each unique covariate pattern (in this case each row) and use this value as the output for another regression analysis.
The calculated standard deviation is shown in the image below.
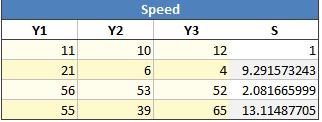
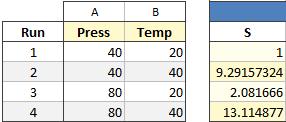
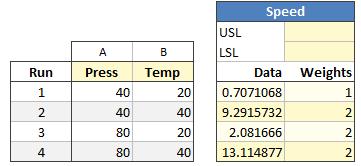
The values for S (standard deviation) are used for the output data in another regression. This is identical to creating another design depicted below.
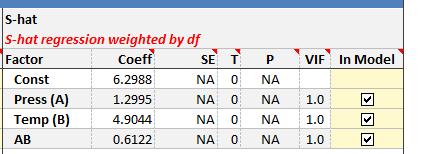
When you run the regression, Quantum XL will create the Y-hat Model and the S-Hat model side by side.
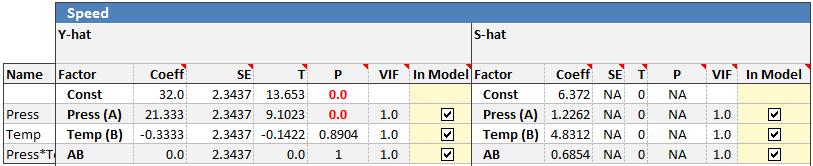
Since the S-hat model will always only have one replicate, the P-values are normally not available in the initial regression, particularly when working with full factorials.
Many experimenters will start removing terms with the smallest coefficients. For this example, the AB interaction has a coefficient of .68 which is half as small as the next smallest. Removing this term allows the p-values to be calculated.
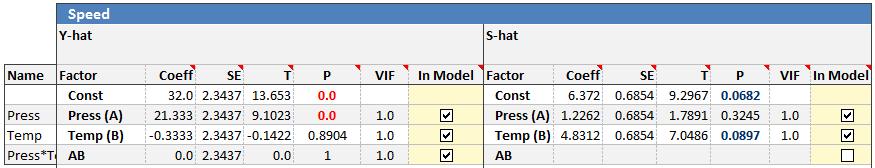
The coefficient for Temp (B) is now in the "blue area" which indicates it is between .05 and .1. Press (A) can be removed since the p-value is quite large resulting in this reduced model.
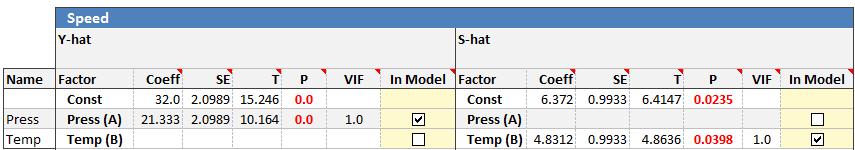
This model indicates that Press (A) shifts the mean while Temp (B) shifts the standard deviation.
Advantages of Modeling S-hat
In most applications it is quite difficult to reduce the standard deviation. Finding a variance reducing factor can be a significant find and in the case of experiments in the commercial sector, can result in a significant financial savings.
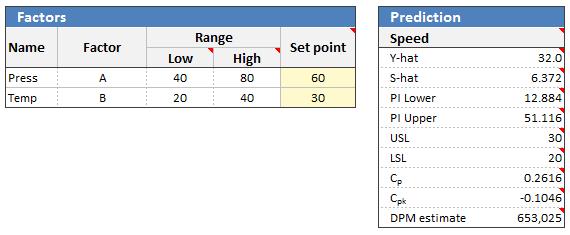
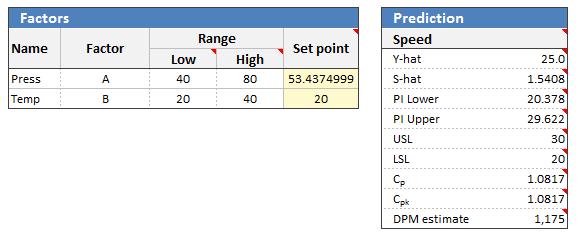
Prediction
Quantum XL will use the S-hat model (if available) as the estimate for standard deviation in the prediction area. Additionally, if the spec limits are provided, estimates for Cp, Cpk, and DPM are provided using the Y-hat as an estimate for the mean and S-hat for the standard deviation.
Optimization
Quantum XL recognizes the S-hat model as a response that can be optimized as either a goal or a constraint. Additionally, if the model includes spec limit(s), then Quantum XL will construct surrogate responses for Cpk and DPM which allow for optimization of both Y-hat and S-hat simultaneously.
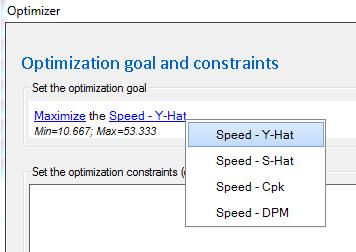
The most common application of this would be to minimize the DPM for the quantitative responses…
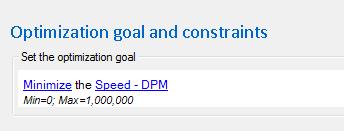
…resulting in the following prediction. Note that the DPM has been reduced from over 600,000 to just over 1,000.
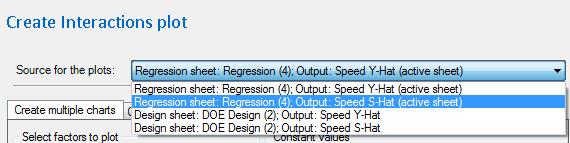
Charts
Any chart that can be created for the Y-hat model can also be created for the S-hat model. To create the chart using the S-hat model, select the item from the Source drop down that indicates it is for S-hat. For more information about the available charts, see DOE Charts.
Unequal Sample Sizes
When the sample sizes differ, the results will be weighted by N-1 degrees of freedom. For example, in the following design the first row has only two replicates.
The standard deviation for run #1 is now based on 2 observations while runs #2, 3, and 4 are based on three. Quantum XL automatically switches to weighted regression with the weights set to 1, 2, 2 and 2 for runs 1, 2, 3, and 4 respectively.
This would be identical to creating another response with the Standard Deviations in the first column for data and using the sample sizes minus one as weights.
When the regression is calculated with uneven weights, Quantum XL will indicate as such at the top of the regression table in red.