Home / Statistical Tools / Analysis Tools / Statistical Tools Data Format
Statistical Tools - Source Data Formats
Data sources
Data for statistical tools can come from a Data Template worksheet, Excel spreadsheet, an SQL data source, or it can be entered manually.
Data Template
Data Template is a convenient way to collect your data in Excel and run Quantum XL analysis. For more information see Data Template.
Excel data source
Use this data source when your data is located in the Excel worksheet, in rows or in columns. When you start a new tool, you will be prompted for the source with the dialog below.
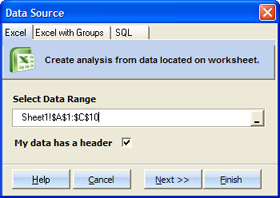
The next step is to select data orientation. Data can be located in columns or rows, or Quantum XL can treat it like one group of data.
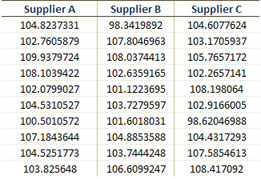
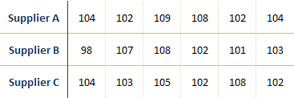
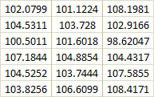
Examples of Excel data sources:
| Data in Columns | Data in Rows | One group of data |
|---|---|---|
 |
 |
 |
Excel with Groups
Use this data source when your data is in "Group By" format.
Example of "Group By" data:
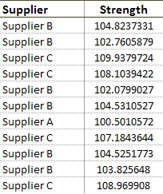
After you select the Excel range with "Group By" data, the next step is to select the Data column and the Group column. In this example, the Data column would be 'Strength', and the Group column would be 'Supplier'.
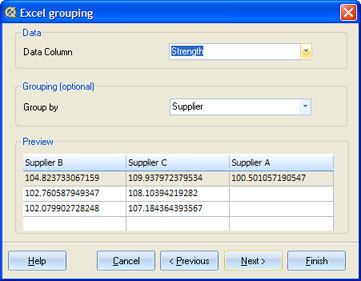
Quantum XL will produce the same number of datasets as there are unique values in the Group By column.
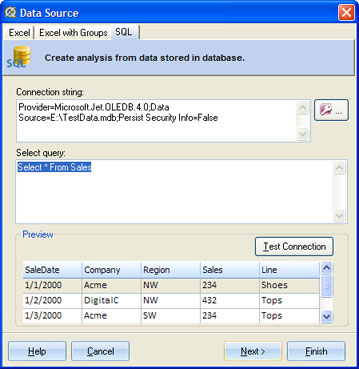
SQL Data source
Use this data source when your data is located in a database.
The first step is to make a connection to the database, using SQL connection and SQL Query. After you create a connection, the next step is to select the data column and group by column. This works in the same way as in Excel with Groups.
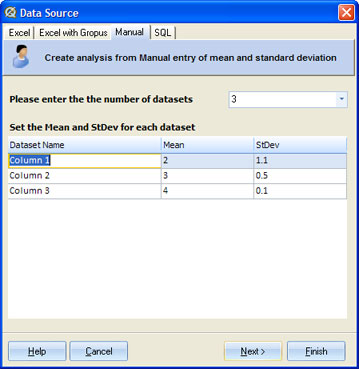
Manual data source
Use this data source when you want to display CPK analysis by providing the Mean and Standard Deviation manually. Select the number of datasets you want to display, and enter values for Dataset Name, Mean, and Standard deviation.