Home / Statistical Tools / Hypothesis Tests / Confidence Intervals
Confidence Intervals
Confidence interval
In some cases, we would like to characterize a population using a statistic such as the mean, median, proportion, etc. For example, we may want to know what proportion of voters intend to vote for a candidate on election day. Measuring the entire population of interest is usually too expensive, so the common approach is to take a representative random sample, calculate the sample statistic, and then infer something about the population of interest. The confidence interval is the amount of error that is expected in the sample statistic.
The typical flow ...
-
Identify the Population of Interest (for example, all likely voters for the election of the Governor of California).
-
Take a sufficiently large representative random sample (for example, 1000 likely voters).
-
Calculate the sample statistic of interest (for example, 580 or 58% intend to vote for candidate #1).
-
Calculate confidence intervals and make conclusions about the population. (58% +/- 3% or 55% to 61% of the population intends to vote for candidate #1. Therefore, if the election were held today, it is likely that candidate #1 would win.)
The confidence interval functionality built into Quantum XL calculates the range in which the population parameter is likely to fall. In the previous example, in our sample of 1000 likely voters, 58% indicated that they intended to vote for Candidate #1. However, this number comes with error since it didn't include the entire population. The confidence interval tells us that the population is likely to fall between 55% and 61%, or put another way, if the election were held today it is likely that candidate #1 will receive 55% to 61% of the total vote.
Support for Confidence Intervals in Quantum XL
Quantum XL supports confidence intervals for Mean, Median, Standard deviation, Proportion, Cp and Cpk.
Confidence intervals are reported as part of appropriate analysis. They are calculated for Confidence Level = 0.95.
Reporting the confidence interval usually includes plot and values for lower and upper confidence bound.
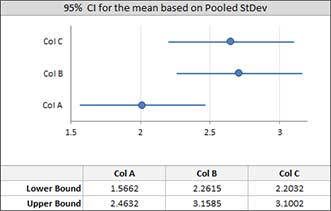
-
CI for the mean. Hypothesis tests for the mean will report confidence intervals per dataset.
-
CI for the median. Hypothesis tests for the median will report 95% CI per dataset.
-
CI for the standard deviation. Variance hypothesis tests report 95% Bonferroni CI's for the standard deviation.
-
Binomial CI. One-sample test for proportion will report 95% binomial CI.
-
Cp and Cpk CI are reported as part of Capability Analysis.