Home / Monte Carlo / Model Building / Convert to visual
Convert to Visual
From Excel click...
QXL Monte Carlo Tab > Create/Modify Design Sheet > Convert to Visual
Quantum XL supports several forms of model building including Free Form Model Building, Create Design (IPO) Sheets, Import from DOE Pro, Merge Designs, Visual Merge, and Convert to Visual. This help topic discusses Convert To Visual.
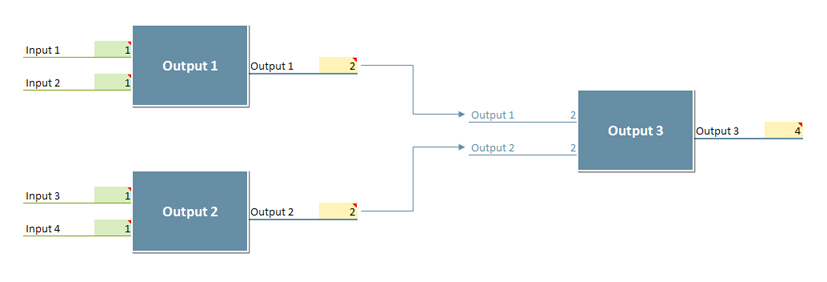
Convert to Visual creates a visual representation of an IPO sheet. It will create a model for each output in the IPO sheet, and connect multiple models based on relationships between inputs and outputs.
In this example, the IPO sheet has 4 inputs and 3 outputs.
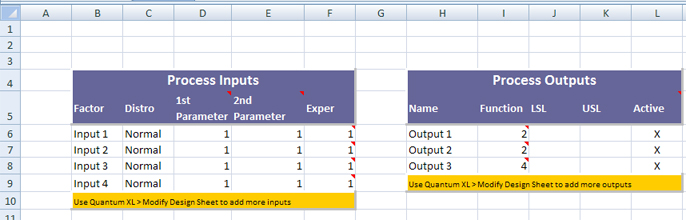
Inputs are in cells F6:F9 and outputs are in I6:I8. Output formulas are:
-
Output 1 -- '=F7+F6' (Input 2 + Input 1)
-
Output 2 -- '=F9+F8' (Input 4 + Input 3)
-
Output 3 -- '=I7+I6' (Output 2 + Output 1)
'Convert to Visual'will detect relationships between inputs and outputs, and create a visual representation of an IPO sheet.
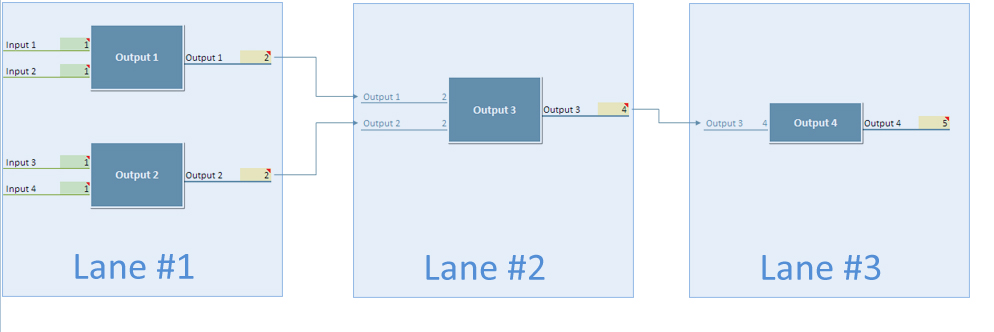
The number of models is the same as the number of outputs. You will notice that Output 3 is in the second 'Lane'. The number of lanes is determined by the complexity of relationships between outputs. If there were a fourth output that was a function of Output 3, then it would be located on the right side of Output 3, in Lane #3.
Limitations
-
Only the legacy IPO sheet format can be 'converted to visual'.
-
Output formulas must not contain ranges. Expressions like '=SUM(F6:F9)' are not valid for the 'Convert to Visual' feature. You should replace ranges with individual cells: '=SUM(F6,F7,F8)'.
-
Named ranges in formulas are not supported. Replace them with cell addresses (A1 notation).
-
Input and output names must be defined and unique. However, all other parameters are optional (like 1st and 2nd input parameter, LSL, USL, ...)
-
There is a maximum of 1,350 lanes.