Home / Statistical Tools / Analysis Tools / Time Series / Cross Correlation
Cross Correlation
From Excel click...
QXL Stat Tools Tab > Analysis Tools > Time Series > Cross Correlation
Cross Correlation is a measure of correlation between two datasets with a lag.
Step #1: Select data source for Analysis.
Two datasets are required as in the example below.
Step #2
From Excel click...
QXL Stat Tools Tab > Analysis Tools > Time Series > Cross Correlation
Step 3: Select the data range which contains your data.
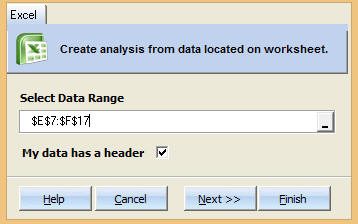
Step 4: Choose Number of Lags.
Use default number of lags: Quantum XL will determine how many lags to use. The larger the dataset, the more lags are available.
Set number of lags: Manually set the number of lags.
Step 5: Press Finish. Quantum XL will complete the analysis.
Plot Area: Quantum XL will plot the correlation vs. the lag.
Cross Correlation Function: Numeric representation of the graph above.
Understanding Cross Correlation and Lag
Large Cross Correlation Function (CCF) values indicate greater positive correlation. Large negative CCF values indicate negative correlation. Values of CCF close to zero indicate low correlation.
Lag is a measure of how many units the data is shifted to determine the correlation.
Example of shift with Lag = -1
Example of shift with Lag = +2