Home / Statistical Tools / Additional Tools / Stack/Unstack Data / Stack Columns
Stack Columns
From Excel click...
QXL Stat Tools Tab > Additional Tools > Stack/Unstack Data > Stack Columns
Stack Columns will transform data that is organized in columns or as a cross table to a database format. Data that is organized in database format can be used as 'Group by' data source for statistical tools.
Standard mode (data in columns)
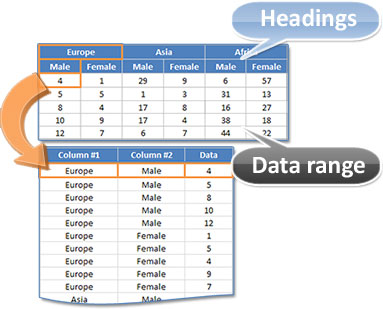
- Source: Multiple data columns where each data column has one or more heading rows.
- Result: Resulting table will have as many columns as there are heading rows plus one column for data. Each data point will have its own row. If data range was in 5 rows and 6 columns, resulting table will have 5 x 6 = 30 rows.
Advanced mode (cross table)
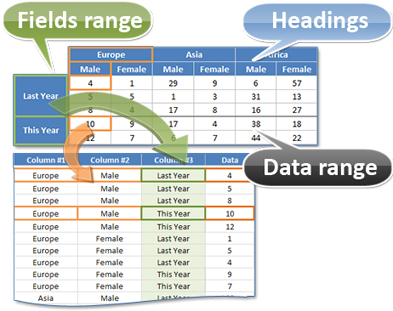
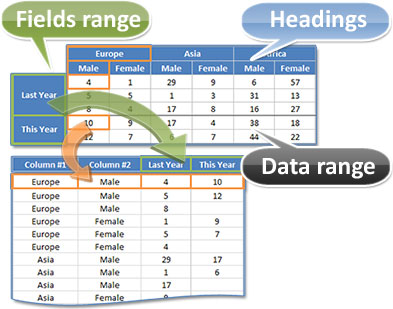
- Source: Cross table with one or more heading rows and one or more field columns.
- Result:
- If 'Data Column' option is set to 'Create a single data column', the resulting table will have as many columns as there are heading rows, one column that has values from 'Fields' range, and one Data column.
- If 'Data Column' option is set to 'Create separate column for each field', the resulting table will have as many columns as there are heading rows, plus the number of unique fields. The data will be located in field columns.
| Create a single data column | Create separate column for each field |
|---|---|
 |
 |
Stack Columns can also work with transposed cross tables. For transposed tables, Headings are located in the leftmost columns while Fields are in the topmost rows.
Noncontiguous ranges are not supported. Although Headings, Fields, and Data ranges do not have to be side by side, each of these ranges must be contiguous.
See also: