Home / DOE / Charts / Chart Source
Chart Source: Regression Model or Raw Design Data
Interaction, Main Effects, and Thumbnail plots can be created from either a regression model or from a DOE Design.
Regression Model: If you choose a regression model, Quantum XL will use the equation derived from the regression model to generate the points required by the plot. For example, if the regression model was Y-hat = 2+3*A+4*B+5*AB and the user asked for the interaction plot of A vs. B, then Quantum XL would use this equation to generate the plot. For example, the point A=1/B=-1 would be calculated as Y-hat = 2+3*1+4*-1+5*1*-1 = -4.
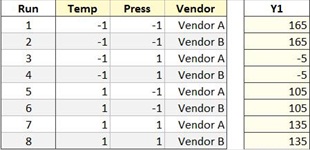
DOE Design: If you choose a design sheet, Quantum XL will calculate the plotted points from the raw data. For example, if you choose the design below for a marginal means plot, then the value for A=-1 would be calculated as the average of 165, 165, -5, -5.
Note
The default source will vary depending on the active sheet at the time the menu item is selected. If the active sheet is a regression table, then the default will be Regression Model. If the active sheet is a design sheet, then the default will be a DOE Design.