Home / Statistical Tools / Hypothesis Tests / Tests For Median / Mood
Mood's Median test
From Excel click...
QXL Stat Tools Tab > Hypothesis Tests > Tests for Median > Mood's Median
| Test type: | Median |
|---|---|
| Data: | Quantitative |
| Number of Variables: | 1 |
| Number of Groups: | 2 or more |
| Assumptions: | Two or more samples from continuous distributions |
Mood's Median test is a hypothesis test used to compare the medians of two or more samples. The null hypothesis is that the medians are equal.
Mood's Median test expects two or more samples from continuous distributions with the same shape. It is similar to one-way ANOVA but for medians instead of means. Mood's median is good if datasets have outliers. If samples do not include outliers the Kruskal-Wallis test is more powerful.
Hypothesis tested:
| H0 : | Median1 = Median2 = ... = Mediann |
|---|---|
| H1 : | Mediani ≠ Medianj |
where Mediank is the population median.
Step #1: Select data source for Mood's Median test.
Data for the Mood's Median test can come from an Excel spreadsheet or SQL data source.
See source data formats and example data for the Mood's Median test.
Step #2: Options.
-
'Decision Criteria' option (default = 0.05). The value of the decision criteria (significance or α level).
-
'Show Box plot' options. Display box plot along with hypothesis results.
-
'Display mode' option. When the 'Verbose (long)' option is on, Quantum XL will display additional text that explains the hypothesis test results.
Example
Three testers have measured the time to load the same web pages. Our intent was to check if there is a difference between load times.
-
Open Mood's Median worksheet.
-
Run Quantum XL > Hypothesis Tests > Tests for Median > Mood's Median.
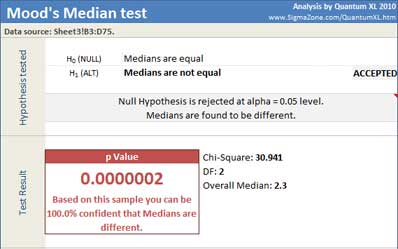
Quantum XL will display Chi-Square test statistic, degrees of freedom, overall median, statistics per sample and p Value.
Since the p-Value (.0000002) is less than the decision criteria (0.05) the null hypothesis can be rejected. We can draw the conclusion that the medians are different.
Quantum XL also displays 95% confidence interval for the median, per sample.
Update
Mood's Median test is updatable. After you create the analysis, you can change its data source or add new data to the data source and simply update the analysis.
-
Update: Quantum XL > Statistical Tools > Update Sheet
-
Change settings: Quantum XL > Statistical Tools > Modify Chart/Analysis