Home / Monte Carlo / Analyzing The Model / Expected Value Analysis
Expected Value Analysis (Run Model)
From Excel click...
QXL Monte Carlo Tab > Run > Choose Number of Simulations
When you select "Expected Value" from the Quantum XL menu, you will be given a sub-menu with options to compute between 100 and 1,000,000 Monte Carlo or Descriptive Sampling (see Options) simulations. With more simulations, the accuracy of the simulation is increased. On most computers, 10,000 simulations takes only a few seconds and provides sufficient accuracy.
The expected value analysis includes a worksheet with expected value statistics and a histogram. It is also possible to show multiple outputs overlaid on a single chart. Quantum XL can present statistics in two different ways, in defects per million or in percentages (see Operational Mode).
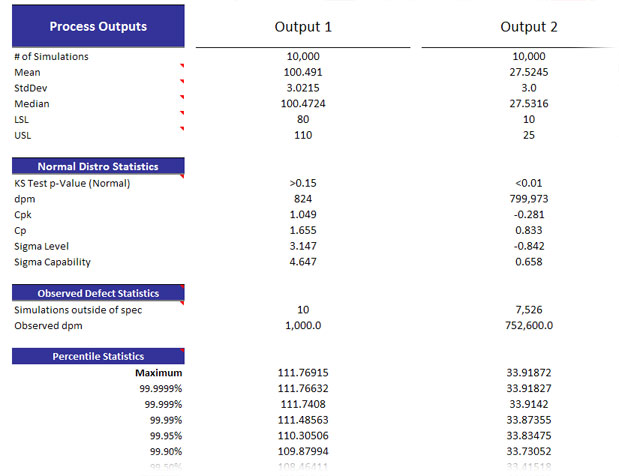
The top portion of the EVA output includes the number of simulations, mean, standard deviation (assuming a normal distribution), median, and associated spec limits.
The center portion of the EVA analysis includes statistics that assume a normal distribution ("Normal Distro Statistics"). The statistics include the KS Test p-value, dpm, Cpk, Cp, Sigma Level, and Sigma Capability. If the distribution is not normal, these statistics are not valid.
The bottom portion of the EVA analysis includes statistics that do not assume a normal distribution ("Observed Defect Statistics"). The number of simulations outside of spec is the actual defects that were observed outside of the spec limits. The observed dpm is the number of actual defects scaled as if 1,000,000 Monte Carlo simulations were computed. Below DPM are the 95% confidence intervals on the dpm based upon the number of observed defects and the size of the Monte Carlo simulation.
Optionally, percentile statistics can be included in the EVA report. In addition to the predefined percentiles, you can define up to four percentile numbers for which you would like to see statistics in the EVA report. Percentile statistics can be turned on/off in the Options dialog.
If your histogram reveals that your output is normally distributed, you should use the "Normal Distro Statistics"; otherwise, you should use the "Observed Defect Statistics".