Home / Statistical Tools / Hypothesis Tests / Tests For Variance / Bartlett
Bartlett's test
From Excel click...
QXL Stat Tools Tab > Hypothesis Tests > Tests for Variance > Bartlett's test
| Test type: | Variance |
|---|---|
| Data: | Quantitative |
| Number of Variables: | 1 |
| Number of Groups: | 2 or more |
| Assumptions: | Normally distributed samples |
Bartlett's test is a hypothesis test used for testing variance equality between samples of two or more populations. It assumes that samples come from independent populations and that they are normally distributed. If samples are not normally distributed, use Levene's test.
Hypothesis tested:
| H0 : | σ1 = σ2 = ... = σn |
|---|---|
| H1 : | σi ≠ σj |
where σk is the population variance.
Step #1: Select data source for Bartlett's test.
Data for the Bartlett's test can come from an Excel spreadsheet, SQL data source, or it can be entered manually.
See source data formats and example data for the Bartlett's test.
Step #2: Options.
-
'Decision Criteria' option (default = 0.05). The value of the decision criteria (significance or α level).
-
'Box Plot'option. Display box plot hypothesis results.
-
'Display mode' option. When the 'Verbose (long)' option is on, Quantum XL will display additional text that explains the hypothesis test results.
Example
-
Run Quantum XL > Hypothesis Tests > Tests for Variance > Bartlett's test.
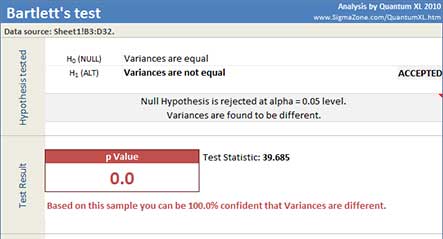
Quantum XL will display test statistic (F), p Value, 95% Bonferroni CI for StDevs, and dataset statistics.
In this example, the p-Value is very small (2*10-9). Since it is less than the decision criteria (0.05), the null hypothesis can be rejected. We can draw the conclusion that the variances are different.
Update
Bartlett's test is updatable. After you create analysis, you can change its data source or add new data to the data source and simply update the analysis.
-
Update: Quantum XL > Statistical Tools > Update Sheet
-
Change settings: Quantum XL > Statistical Tools > Modify Chart/Analysis