Home / Monte Carlo / Model Building / Custom Distributions
Custom Distributions
From Excel click...
QXL Monte Carlo Tab > Create/Modify Design Sheet > Custom Distributions
In addition to built-in distributions, Quantum XL supports custom distributions. Custom distributions are defined by the user and saved in the workbook.
The user can define two types of custom distributions: Continuous and Discrete.
Continuous custom distributions
Continuous distributions are made of multiple segments. Each segment is defined by three values: X Low, X High and Y (relative probability).
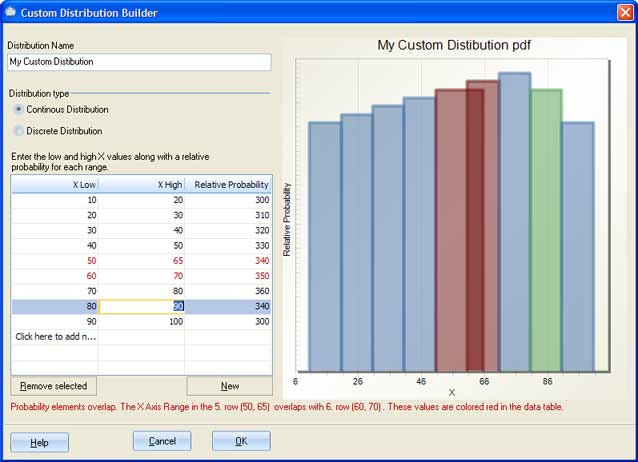
A grid is used for data input. Segments are plotted on the chart in the right part of the dialog. Each time you enter X Low and X High values in the last row of the data grid, a new row will be created and is ready for the input. The segment on the plot is colored differently for the row that has focus than for the other segments.
In the case that you enter two segments that overlap, Quantum XL will color in red all rows and segments on the plot that overlap. A warning message will show up below the grid. Usually, the problem is in the last red row.
The next image shows how different segments are colored. The row that currently has focus is represented in green. Rows 5 and 6 have ranges that overlap. These segments are in red on the plot.
Discrete custom distributions
Discrete distributions are made of bars. Each bar is defined by two values: X and Y (relative probability).
A grid is used for input. Bars are plotted on the chart in the right part of the dialog. Each time you enter an X value in the last row of the data grid, a new row will be created and is ready for the input. The segment on the plot is colored differently for the row that has focus than for the other segments.
Remove custom distributions
When you are editing already saved custom distributions, the button 'Remove Distribution' will become available. It is located in the right bottom part of the dialog. Use this button to remove custom distributions from the workbook.