Home / DOE / Charts / Surface and Contour Plot
Surface and Contour Plot
From Excel click...
QXL DOE Tab > Charts > Surface and Contour Plot
Create Surface and Contour Plots from a regression model by selecting QXL DOE Tab > Charts > Surface and Contour Plot.
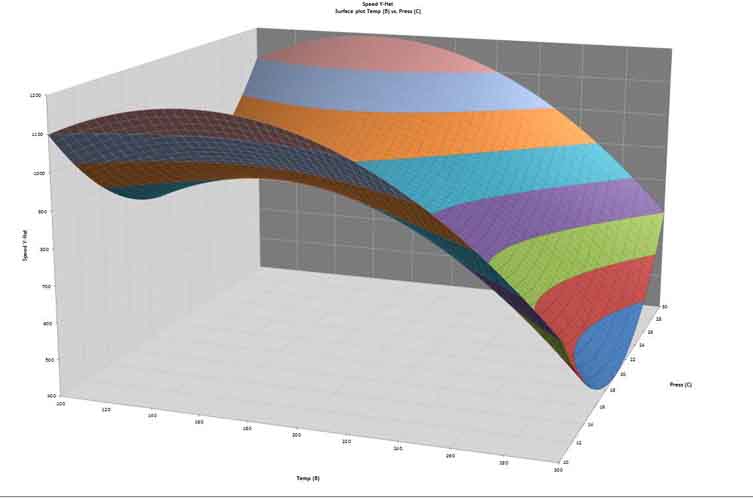
Surface and contour plots are a 3-Dimensional graphical representation of two variables and their impact on the output. Unlike marginal means, interaction, and thumbnail plots, only regression models can be used as the source for Surface and Contour plots.
The surface plot below was created from a Central Composite Design with strong quadratic effects.
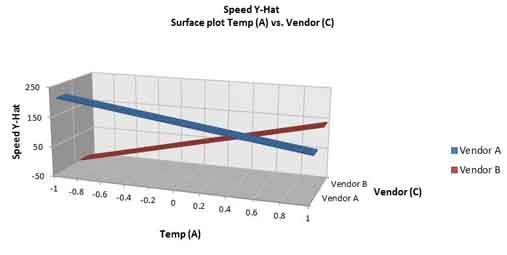
The following plot was created from a two-level plot with one Quantitative and one Categorical input.
Select Factors to Plot
Select two variables using the drop down boxes along with the range for the plot. The default low and high values are the bounds of the DOE.
Use the check boxes to optionally create the surface plot, contour plot, or both.
Optionally, choose the set points for all factors that are not included in the graph.