Home / Statistical Tools / Analysis Tools / Summary Statistics
Summary Statistics
From Excel click...
QXL Stat Tools Tab > Analysis Tools > Summary Stats
Summary statistics are located under the "QXL Stat Tools" ribbon --> Analysis Tools --> Summary Stats. Quantum XL will prompt you to enter the Excel range which contains the data you would like to analyze. Select the data and press "Next". You may select which statistics to include in the analysis.
Step #1: Select data source for Summary Statistics.
Data for the Histogram can come from an Excel spreadsheet or SQL data source. See source data formats.
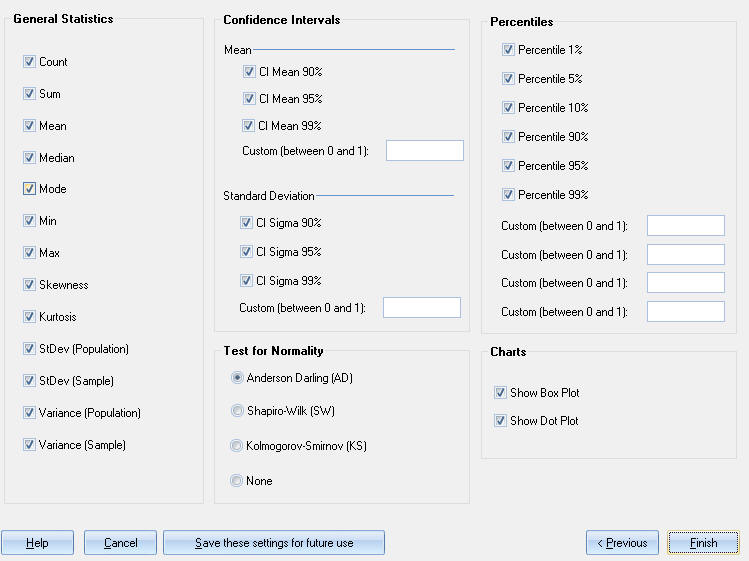
Step #2: Summary Statistics Options
Choose which statistics you would like to include in your analysis.
Step #3: Press Finish
Quantum XL will create the Summary Statistics for your data set(s).
Click here for more information about the Anderson-Darling, Shapiro-Wilk, and/or Kolmogorov-Smirnov test.
Update
Summary Statistics analysis is updatable. After you create the initial analysis, you can change its settings, change the data source, or add new data to the data source and simply update chart.
- Update Summary Stats chart: QXL Stat Tools > Update Workbook
- Change settings: QXL Stat Tools > Modify Analysis
- Change data source: QXL Stat Tools > Data Source