Home / Statistical Tools / Analysis Tools / Pareto
Pareto
From Excel click...
QXL Stat Tools Tab > Analysis Tools > Pareto
A Pareto is a column chart where the height of each column represents frequency. Columns are usually sorted in descending order.
Step #1: Select data source for Pareto.
Data for the Pareto can come from an Excel spreadsheet or SQL data source. See source data formats.
Depending on the data source selected, you can create single Pareto, multiple Paretos or a grid of Pareto charts.
Step #2: Pareto options
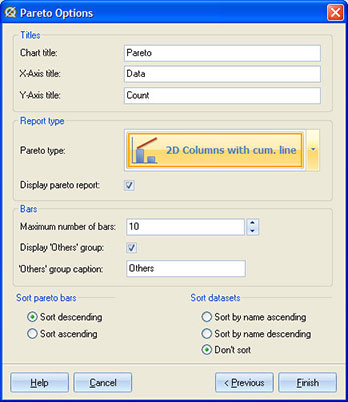
- Titles section allows you to change the chart title and titles of X and Y axis.
- Pareto type - Quantum XL can plot 3 different Pareto reports: '2D Columns', '2D Columns with cumulative line' and '3D Columns'.
- Pareto report - You can choose to display a Pareto report along with the Pareto chart. Pareto report displays the frequency of each element and its percentage.
- Maximum number of bars option controls how many bars you want to be displayed on a Pareto chart. If the actual number of bars is greater than this value, they will either be cut off or placed in the Others group, depending on Pareto settings.
- Others group contains all the bars that did not fit on a Pareto report. For example, if your Pareto has 20 bars, and Maximum number of bars was set to 10, then the final Pareto report will contain 9 bars + 1 'Others' bar, where 'Others' bar is the sum of 11 remaining bars. You can change the name of that bar (default is 'Others') and choose whether to display it on a Pareto chart or not.
- Sorting - Pareto bars are usually sorted in descending order. However, you can choose between ascending and descending order. Note that the Others group is not included in the sorting procedure. It is always the rightmost bar for descending order, and the leftmost bar for ascending order.
- Sorting datasets - If your data source produces multiple Pareto charts or a grid of Paretos, you can customize the order of dataset appearance by sorting datasets by their names.
Update
Pareto charts are updatable. After you create a Pareto, you can change its settings, change the data source, or add new data to the data source and simply update chart.
- Update Pareto chart: Quantum XL > Statistical Tools > Update Sheet
- Change settings: Quantum XL > Statistical Tools > Modify Chart/Analysis
- Change data source: Quantum XL > Statistical Tools > Change data source