Home / Statistical Tools / Analysis Tools / Capability Scorecard
Capability Scorecard
From Excel click...
QXL Stat Tools Tab > Analysis Tools > Capability Scorecard
The capability scorecard will calculate defects per unit (dpu), defects per opportunity (dpo), and defects per million opportunities (dpmo) for multiple parts/processes simultaneously.
Step #1: Select data source for the Capability Scorecard.
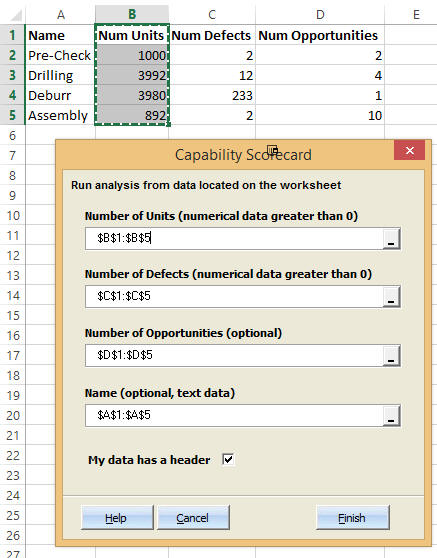
Before starting the report, it is helpful to have your data set up in the columns Number of Units, Number of Defects, Number of Opportunities (optional), and Name (optional).
Number of Units: The total number of units which could have been defective.
Number of Defects: The number of defects found in the units.
Number of Opportunities: The number of ways each unit could be defective (optional).
Name: A description of each row (optional).
The example below is for a manufacturing process with four steps. The process has four steps with associated defect information.
Step #2
From Excel click...
QXL Stat Tools Tab > Analysis Tools > Capability Scorecard
Step #3: Select the data range and press Finish
Quantum XL will calculate the following numerical results.
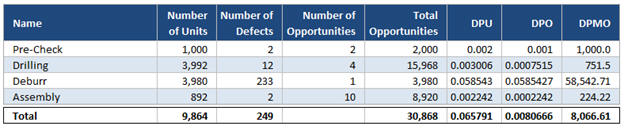
Total Opportunities
Number of Opportunities * Number of Units = Total Opportunities
Defects per Unit (DPU)
Number of Defects / Number of Units = DPU
Defects per Opportunity (DPO)
Number of Defects / Total Opportunities = DPO
Defects per Million Opportunities (DPMO)
DPO * 1,000,000 = DPMO
Additionally, Quantum XL creates a Pareto Diagram for DPU and DPMO for each of the steps. From the numerical analysis and Pareto diagrams, it is evident that the Deburr is the primary contributor to defects.