Home / Statistical Tools / Analysis Tools / MultiVari
Multi-Vari
From Excel click...
QXL Stat Tools Tab > Problem Solving >Multi-Vari Charts
Multi-Vari analysis graphically represents different sources of process variation. There are three families of process variation that can be observed on Multi-Vari charts:
-
Positional (within a subgroup)
-
Cyclical (between groups)
-
Temporal (over time)
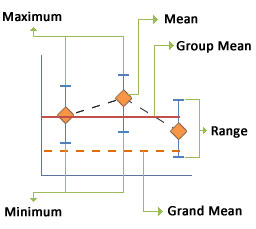
Multi-Vari elements
Step #1: Select data source for Multi-Vari.
Data for the Multi-Vari analysis can come from an Excel spreadsheet or SQL data source. See source data formats. Using the Group-By option will allow you to create multiple charts and observe the Temporal variation.
Step #2: Multi-Vari options
Select which elements you want to display on a Multi-Vari chart.
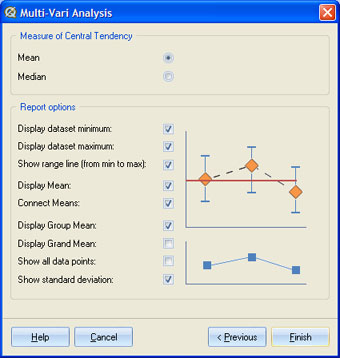
You can choose to show the dataset minimum, maximum, and range line; display the markers for the Mean; and connect the Mean markers with a dash line. You can also display the Group Mean, Grand Mean, and all data points. Selecting 'Show standard deviation' will create an additional chart below the Multi-Vari chart.
You can also choose whether to use dataset Mean or Median.
Update
Multi-Vari chart is updatable. After you create a Multi-Vari analysis, you can change its settings, change the data source, or add new data to the data source and simply update chart.
-
UpdateMulti-Vari chart: Quantum XL > Problem Solving > Multi-Vari Charts >Update
-
Change settings: Quantum XL > Problem Solving >Multi-Vari Charts >Modify Chart