Home / Statistical Tools / Analysis Tools / Time Series / Partial Autocorelation
Partial Autocorrelation
From Excel click...
QXL Stat Tools Tab > Analysis Tools > Time Series > Partial Autocorrelation
Partial Autocorrelation Function (PACF) identifies the lag in an autoregressive model.
Step #1: Select data source for Analysis.
A single dataset in time series order is required for the analysis. The dataset for this example can be downloaded for your analysis.
Step #2
From Excel click...
QXL Stat Tools Tab > Analysis Tools > Time Series > Partial Autocorrelation
Step 3: Select the data range which contains your data.
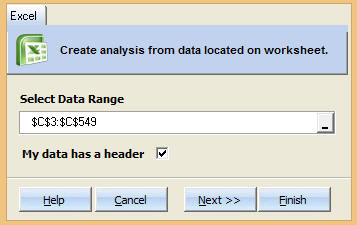
Step 4: Choose Number of Lags.
Use default number of lags: Quantum XL will determine how many lags to use. The larger the dataset, the more lags are available.
Set number of lags: Manually set the number of lags.
Step 5: Press Finish. Quantum XL will complete the analysis.
Plot Area: Quantum XL will plot the correlation vs. the lag. The dotted red lines are the 95% upper and lower significance limits. Any bars exceeding the red lines indicate a non-random effect.
Cross Correlation Function: Numerical analysis of the data.
ACF: Autocorrelation function -- Large positive or negative values indicate more correlation.
T Stat: The ACF divided by the standard error. Larger T Statistics indicate more significance.