Home / Statistical Tools / Analysis Tools / Run Chart
Run Chart
From Excel click...
QXL Stat Tools Tab > Analysis Tools > Run Chart
A Run Chart is a simple line plot of time series data.
Step #1: Select data source for the Run Chart.
The data must be in one or more columns. For every column of data, Quantum XL will create an overlapping run chart.
Step #2: Select QXL Stat Tools Tab > Analysis Tools > Run Chart
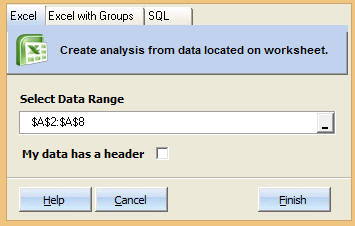
Step #3: Select the data range and press Finish
Update
The run chart is updatable. After you create the initial analysis, you can change its settings, change the data source, or add new data to the data source and simply update chart.
- Update Run chart: QXL Stat Tools > Update Workbook
- Change settings: QXL Stat Tools > Modify Analysis
- Change data source: QXL Stat Tools > Change Source