Home / Statistical Tools / Analysis Tools / Time Series / Trend Analysis
Trend Analysis
From Excel click...
QXL Stat Tools Tab > Analysis Tools > Time Series > Trend Analysis
Calculates the appropriate linear or quadratic time series models when there is no seasonal trend in your data.
Step #1: Select data source for Analysis.
Example: Below is an example of a dataset ready for analysis.
Step #2
From Excel click...
QXL Stat Tools Tab > Analysis Tools > Time Series > Trend Analysis
Step 3: Select the data range which contains your data.
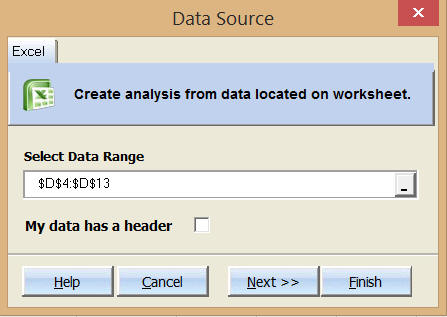
Step 4: Choose Model Type and Forecast Units
Model Type: Can be linear or quadratic. Choose linear if it appears the trend doesn't change. Choose quadratic if there is a curve in the trend.
Number of forecast points: Enter an integer greater than or equal to one. Quantum XL will predict the future value based on the number of units. For example, if the data is monthly sales values and you enter 5, Quantum XL will predict the sales five months into the future.
Step 5: Press Finish. Quantum XL will complete the analysis.
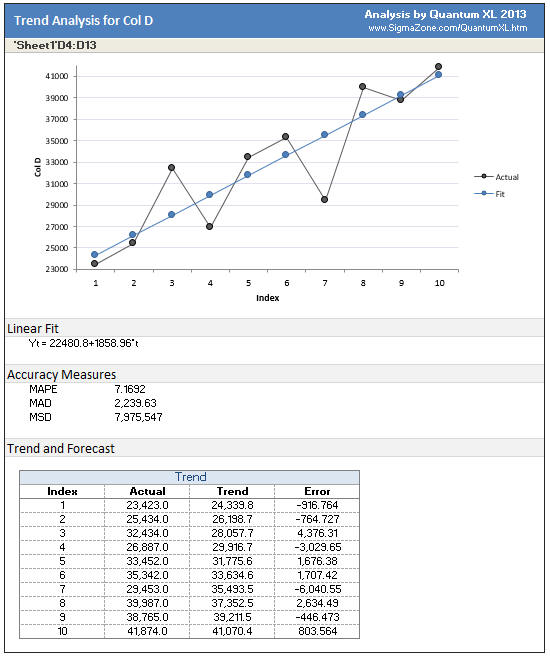
Plot Area: Quantum XL will plot the series along with the best fit model to predict sales.
Linear/Quadratic Fit: Quantum XL will display the equation for the line.
Accuracy Measures: See Time Series Measures of Accuracy
Trend and Forecast: For each data point, Quantum XL will provide the actual value, predicted, and the error in the prediction.