Home / Statistical Tools / MSA / MSA Statistics
MSA Statistics
An MSA is used to determine how much the variation within the measurement process contributes to overall process variability. The overall process variability is divided into the following categories:
Equipment Variation (EV) - Repeatability
Variation in measurements obtained by the same operator using the same measuring instrument while measuring the identical characteristic on the same part several times. This is a variation due to gage, or within-system variation.
Operator (appraiser) Variation (AV) - Reproducibility
Variation in the average of the measurements made by different operators on the same part, using the same gage. This is a variation due to operator, or between-system variation.
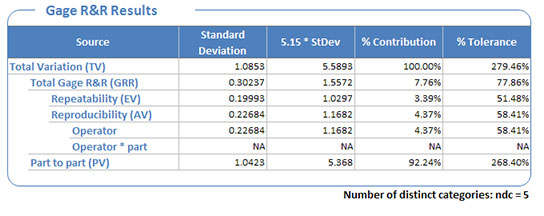
Repeatability & Reproducibility (Gage R&R, or GRR)
Gage repeatability and reproducibility represents Measurement System Variation. It is a combined estimate of variations due to gage (repeatability) and operator (reproducibility).
A general rule of thumb for the Total Gage R&R (GRR) Percent Tolerance is as follows (Reference AIAG MSA 3rd ed., page #77):
- GRR < 10% is acceptable
- GRR from 10% to 30% is marginal, depends on application
- GRR over 30% is unacceptable
Part Variation (PV)
The variation in the data from part variation. The range of parts selected for the MSA will directly affect part variation. If possible, parts should be selected randomly to ensure that they are representative of the actual parts.
Along with a process variability, the following values are also calculated:
Number of distinct categories (ndc)
Number of distinct categories is equal to 1.41 * (PV / GRR). The number is truncated to the nearest integer, except when the value is less than 1 (in that case, ndc=1). NDC is the number of non-overlapping 97% confidence intervals that will span the expected product variation. If ndc is greater than or equal to 5, the measurement system is acceptable. Reference AIAG MSA 3rd ed., page 117.
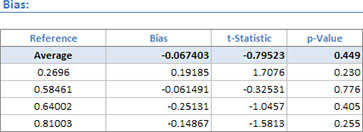
Bias
The bias is the difference between the reference value and average measurement. Quantum XL will report total average bias and bias for each distinct reference value. The bias is statistically zero if the p-Value is >= 0.05. A measurement system that has a non-zero bias should be recalibrated (if possible). Reference: AIAG MSA 3rd ed., page #91.
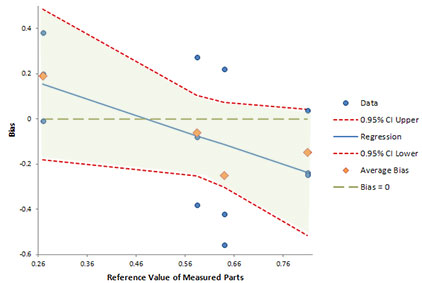
Linearity
Linearity is a difference of bias throughout the expected operating range of the equipment.
For the measurement system to be acceptable, the 'bias = 0' line must lie entirely in the confidence bands of the regression line. Below are examples of the acceptable and unacceptable measurement systems.
| Acceptable measurement system ('bias=0' line lies within 95% CI) | Unacceptable measurement system ('bias=0' doesn't lie within 95% CI) |
|---|---|
 |
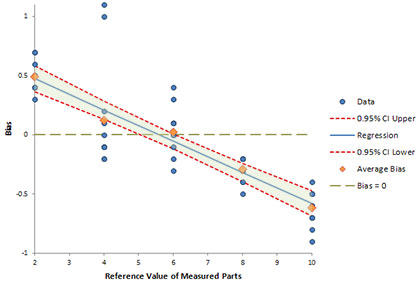 |
Numerically, this can be analyzed by looking at the slope and intercept of the regression line. If the p-Value for the slope is >= 0.05, then the measurement system statistically has the same bias for all the reference values. If the p-Value for the const is >= 0.05, then the bias is statistically zero. If both slope and const p-Values are >= 0.05, then the linearity is acceptable. Reference: AIAG MSA 3rd ed., page #94.