Home / Statistical Tools / Hypothesis Tests / Attribute Tests / One proportion test
One proportion test
Quantum XL > Hypothesis Tests > Attribute Tests > One proportion test
| Test type: | Proportion |
|---|---|
| Data: | Qualitative |
| Number of Variables: | 1 |
| Number of Groups: | 1 |
| Assumptions: | One sample of Binomial (YES/NO) data |
The one proportion test is a hypothesis test for the significance of the difference between the population proportion and a hypothesized value.
You can use the one proportion test when the following conditions are met:
-
One data sample.
-
Sample consists of Binomial (YES/NO) data.
-
nπ0 > 10 and n(1-π0) > 10, where n is sample size and π0 is the hypothesized proportion.
Hypothesis tested:
| H0 : | π = π0 |
|---|---|
| H1 : | π ≠ π0 |
where π is the population proportion, and π0 is the hypothesized proportion.
Step #1: Select data source for one proportion test.
Data for the one proportion test can come from an Excel spreadsheet, SQL data source, or it can be entered manually.
See source data formats and example data for the one proportion test.
Step #2: Options.
Standard options
-
'Not equal to' option. Select this option to run a two tailed test. The alternative hypothesis is that the population proportion and hypothesized proportion are different.
-
'Less Than' option. Select this option to run a lower tailed test. The alternative hypothesis is that the population proportion is smaller than the hypothesized proportion .
-
'Greater Than' option. Select this option to run an upper tailed test. The alternative hypothesis is that the population proportion is greater than the hypothesized proportion .
-
'Hypothesized proportion'. The value of the hypothesized proportion. The value should be greater than 0 and less than 1.
Advanced options
-
'Decision Criteria' option (default = 0.05). The value of the decision criteria (significance or α level).
-
'Normal approximation' option. Use the normal approximation of the binomial distribution to calculate the test. The default is to use exact method. Quantum XL uses 'method of small p-Values' to calculate two-sided p-Value for the proportion.
-
'Display mode' option. When the 'Verbose (long)' option is on, Quantum XL will display additional text that explains the hypothesis test results.
Example
-
Run Quantum XL > Hypothesis Tests > Attribute tests > One proportion test.
-
In the Options dialog, select 'Not equal to' test, and enter 0.7 for the hypothesized proportion.
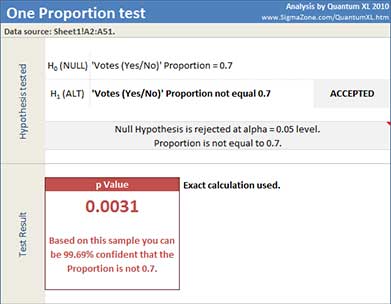
Quantum XL will display p Value, 95% confidence interval and dataset statistics.
In this example, p-Value of 0.0031 is smaller than the decision criteria (0.05) so null hypothesis can be rejected. We can conclude that proportion is not equal 0.7.
Update
One proportion test is updatable. After you create analysis, you can change its data source or add new data to the data source and simply update the analysis.
-
Update: Quantum XL > Statistical Tools > Update Sheet
-
Change settings: Quantum XL > Statistical Tools > Modify Chart/Analysis