Home / Statistical Tools / Analysis Tools / Pareto / Examples / Continuous Frequency
Continuous Frequency
When each observation has an associated measurement (like revenue, cost, or time), use a Continuous column as the frequency. This creates a Pareto chart weighted by that measurement rather than by simple counts. Continuous data can include decimal values and even negative numbers—Quantum XL handles both seamlessly.
Goal
Create a Pareto chart showing regions ranked by total revenue, revealing which regions contribute the most to overall performance.
Sample Data
Download Pareto_ContinuousFrequency.xlsx
Excel Protected View
When you open downloaded files, Excel displays a Protected View warning. You must click Enable Editing before you can use Quantum XL with the file.

Alternatively, you can copy the sample data from the table below and paste it directly into a new Excel workbook.
| Region | Revenue |
|---|---|
| North | 245.78 |
| South | 89.32 |
| North | 187.45 |
| East | 52.16 |
| West | -12.50 |
| North | 312.67 |
| South | -45.29 |
| East | 78.93 |
| West | 15.41 |
| North | 156.22 |
Each row represents one transaction with its revenue value. Note that this data includes decimal values and negative numbers (representing returns or adjustments). Quantum XL will sum the revenue for each region to determine the Pareto ranking.
Steps
-
Launch the analysis
From the Excel ribbon, select QXL Stat Tools → Analysis Tools → Pareto.
-
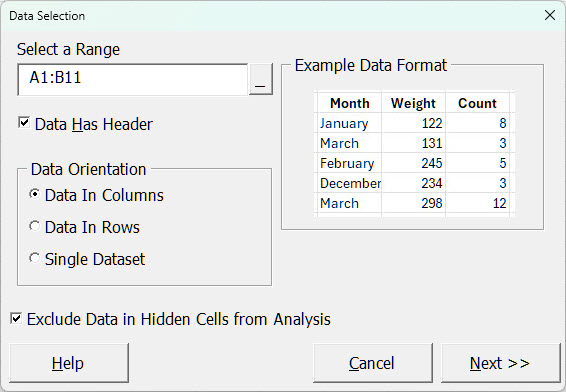
Select your data
Select cells A1:B11 (the header row plus all 10 data rows).
-
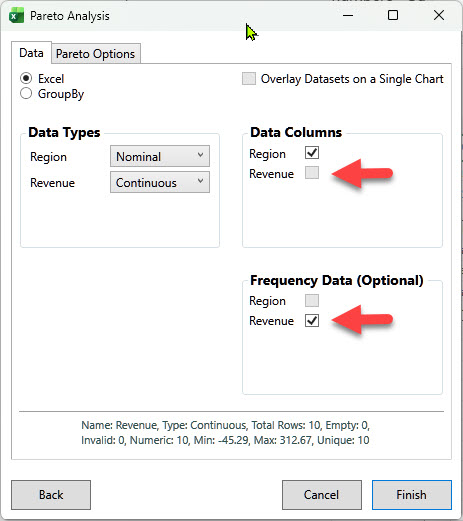
Configure the analysis
In the Pareto Analysis dialog:
- Data Columns: Uncheck "Revenue"
- Frequency Data (Optional): Check "Revenue"
Click Finish to generate the chart.
Result
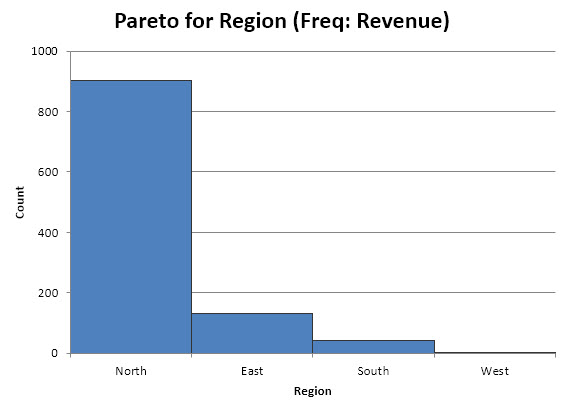
Quantum XL sums the revenue for each region:
- North: 902.12 (4 transactions)
- East: 131.09 (2 transactions)
- South: 44.03 (2 transactions, including one negative)
- West: 2.91 (2 transactions, includes one negative)
Negative Values in Pareto Analysis
Traditional Pareto charts are designed for non-negative data such as counts or costs. Quantum XL extends this capability by allowing negative values in continuous frequency analysis, enabling more comprehensive financial analysis where returns, refunds, or adjustments need to be factored into category rankings.
The chart handles negative values in the data. Notice that West has a small positive total because its sale (15.41) slightly outweighs its refund (-12.50). This demonstrates how continuous frequency analysis reveals the true financial impact of each category, properly accounting for both positive and negative values.