Home / Statistical Tools / Analysis Tools / Capability Analysis
Capability Analysis
From Excel click...
QXL Stat Tools Tab > Analysis Tools > Capability Analysis
Process Capability is the process' ability to meet the specifications. The process capability is expressed through statistical measurements of process capability indices such as Cp, Cpk, Pp, Ppk, dpm and others. Capability Analysis produces a report that includes both a graphic and numerical analysis.
Step #1: Select the data source for Capability Analysis.
The data for a Capability Analysis can come from an Excel spreadsheet, SQL data source, or it can be entered manually. See source data formats for more information.
Step #2: Options
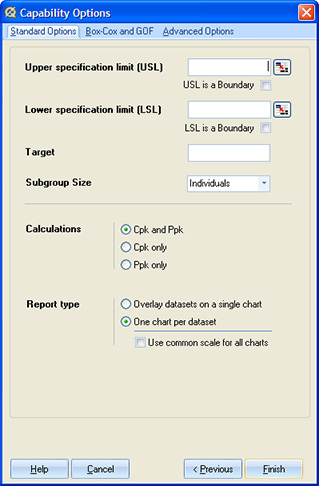 |
Standard options Specification limits. Enter the Upper and/or Lower specification limit. If the 'Boundary' check box is checked, the specification limit is defined as a hard limit. This means that the process cannot exceed the boundary value. Capability statistics (Cpl/Cpu and Ppl/Ppu) and Defects per million (PPM < USL or PPM > USL) will not be reported for hard limits. Target. The target is usually, but not always, centered between specification limits. It is the ideal value of the product. Subgroup size. This option is available if there is only a single data column. If there are multiple columns, the number of subgroups will be determined by the number of columns. Calculations. Quantum XL can report short term calculations only (Cpk), long term only (Ppk), or both. Report type. This option is available when you run Quantum XL > Statistical Tools > Capability Analysis (Multi). Quantum XL has options to overlay all datasets on the same graph or to create a separate graph for each analysis. If 'Common Scale' is checked, all charts will have the same scale. |
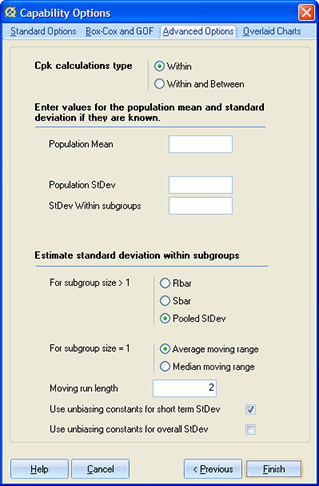 |
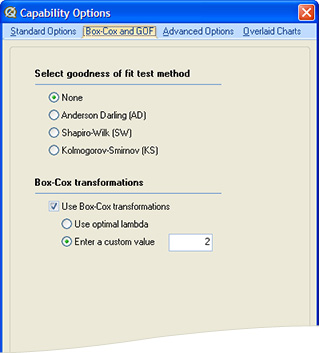
Advanced options Cpk calculation type. Select whether to report 'within' analysis only, or both 'within' and 'between'. This option is available if short term calculations are enabled, and when subgroup size is greater or equal to 2. It is grayed if the subgroup size is set to 'Individuals'. Historical values. Provide values for the mean and standard deviation (long term and short term) if they are known process parameter or can be obtained from the past data. If you provide one of these values, Box-Cox transformations cannot be used. Estimate Standard Deviations methods. Quantum XL uses different methods for estimating short term standard deviation, based on calculation type and number of subgroups. See table below. Moving run length is used for calculating short term Standard Deviation when the subgroup size is 1 (individuals), or between subgroups. Unbiasing constants. Check these options to use bias correction factors in calculating short term and overall Standard Deviation. Default is to use unbiasing constants for short term calculations. |
Standard Deviation Estimation Methods:
| Cpk calculation type | Condition | Methods |
|---|---|---|
| Within | Subgroup size > 1 | Rbar, SBar, Pooled StDev (default) |
| Within | Subgroup size = 1 | Average Moving range (default), Median Moving range |
| Between | Average Moving range (default), Median Moving range |
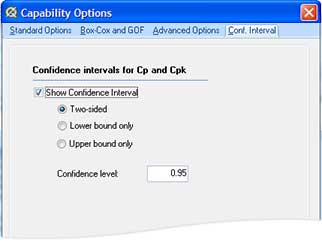 |
Confidence Interval Use this tab to display confidence interval for Cp and Cpk. You can select between two sided and single sided CI', and you can adjust confidence level (a value between 0 and 1). Default value for the confidence level is 0.95 |
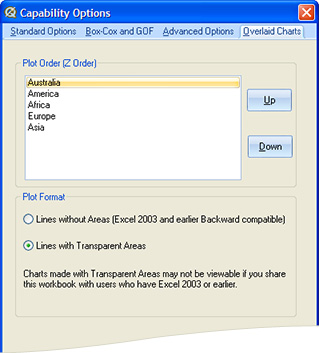 |
Overlaid Charts This tab is visible when the report type is set to 'Overlaid Charts'. You can define the plot order (which dataset is displayed on top) and fill type for the areas under the short term curves. Excel can display transparent areas, allowing you to see all plotted data regardless if the areas overlap. |
Report
Chart
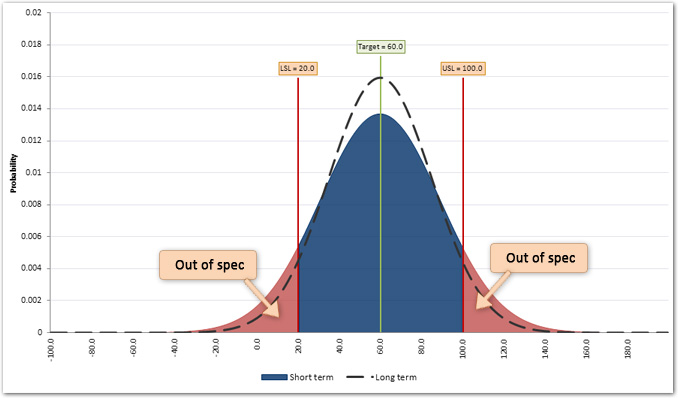
Quantum XL displays following information on the Capability Report chart:
-
Short term curve. The area under the curve is filled. For the overlaid type report, the areas will be transparent.
-
Area out of spec. Parts of the Short Term area beyond the specification limits. The out of spec areas are colored in red.
-
Long term curve. It is represented by a thick dotted line.
-
Specification limits.
-
Target line.
Statistics
Quantum XL reports the statistics below the chart. See statistics for more information.