Home / Statistical Tools / Data Selection
Data Selection
The Data Selection dialog is the first step when launching most Quantum XL analysis tools. It allows you to specify which cells contain your data and how that data is organized.
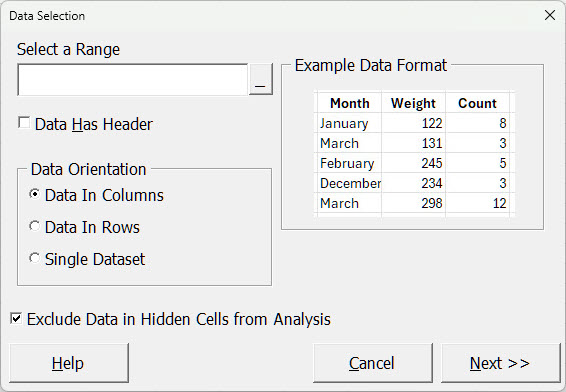
Select a Range
Enter the cell range containing your data. You can either:
- Select with the mouse — Click and drag to highlight your data range in the worksheet
- Type the address — Enter a range address directly (e.g.,
A1:C15orSheet1!A1:C15)
The range should include your data and, if applicable, the header row or column.
Data Has Header
When checked, Quantum XL treats the first row (for Data In Columns) or first column (for Data In Rows) as column/variable names rather than data values.
With Header Checked
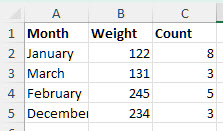
Column names from header row:
- Month
- Weight
- Count
Without Header Checked
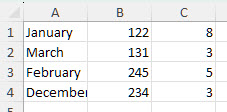
Column names from Excel columns:
- Col A
- Col B
- Col C
Naming behavior when unchecked:
- Data In Columns: Columns are named using Excel's column letters (Col A, Col B, Col C, etc.)
- Data In Rows: Rows are named using row numbers (Row 1, Row 2, Row 3, etc.)
- Single Dataset: You are prompted to enter a dataset name
Data Orientation
Quantum XL supports three data layouts. Select the option that matches how your data is arranged in the worksheet.
Data In Columns
The most common Excel layout. Each column represents a variable, and each row represents an observation or record.
Use this orientation when:
- Your data has column headers across the top
- Each row is a single observation (e.g., one measurement, one transaction, one record)
- You have multiple variables to analyze
Data In Rows
A transposed layout where each row represents a variable and each column represents an observation.

Use this orientation when:
- Your data has row headers down the left side
- Each column is a single observation
- Your data was exported or arranged in a transposed format
Single Dataset
A simple block of numeric values with no headers. All selected cells are treated as a single dataset.
Use this orientation when:
- You have a contiguous block of numbers
- There are no row or column headers
- All values belong to a single variable
When Single Dataset is selected, you must enter a Dataset Name to identify the data in the analysis output.
Exclude Data in Hidden Cells from Analysis
When checked, any data in hidden rows or columns is excluded from the analysis. Hidden cells are treated as if they do not exist—they are not counted, averaged, or included in any calculations.
This option is useful when you want to:
- Analyze a subset of your data without deleting rows
- Exclude outliers or invalid records temporarily
- Focus on specific categories or time periods
Using Excel Table Filters with Quantum XL
When you filter an Excel Table, Excel hides the rows that don't match your filter criteria. If Exclude Data in Hidden Cells from Analysis is checked, Quantum XL analyzes only the visible (filtered) data.
This provides a powerful workflow: filter your Excel Table to show only the records you want to analyze, then run your Quantum XL analysis. The results will reflect only the filtered subset, not the entire dataset.
For example, if you have sales data for all regions but filter to show only "Northeast", a Pareto chart created with this option checked will analyze only the Northeast data.
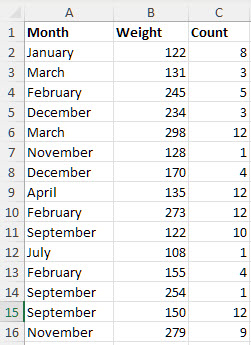
Tutorial Workbook
Download the example workbook to practice with each data orientation:
The workbook contains sheets demonstrating each data orientation and header option:
- Data In Columns — Month, Weight, and Count data arranged vertically
- Data In Rows — The same data transposed horizontally
- Single Dataset — A block of numeric values without headers
- Data With Header — Example showing data with a header row
- Data Without Header — Example showing data without a header row