Home / Statistical Tools / Analysis Tools / Time Series / Autocorelation
Autocorrelation
From Excel click...
QXL Stat Tools Tab > Analysis Tools > Time Series > Autocorrelation
Autocorrelation is the correlation of a signal with itself. Autocorrelation can be used to find patterns in data such as periodic signal or signals analysis of harmonic frequencies. Autocorrelation is also called serial correlation as the analysis is done with various time lags.
Step #1: Select data source for Analysis.
A single dataset in time series order is required for the analysis. The dataset for this example can be downloaded for your analysis.
Step #2
From Excel click...
QXL Stat Tools Tab > Analysis Tools > Time Series > Autocorrelation
Step 3: Select the data range which contains your data.
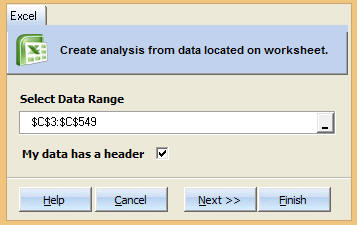
Step 4: Choose Number of lags.
Use default number of lags: Quantum XL will determine how many lags to use. The larger the dataset, the more lags are available.
Set number of lags: Manually set the number of lags.
Step 5: Press Finish. Quantum XL will complete the analysis.
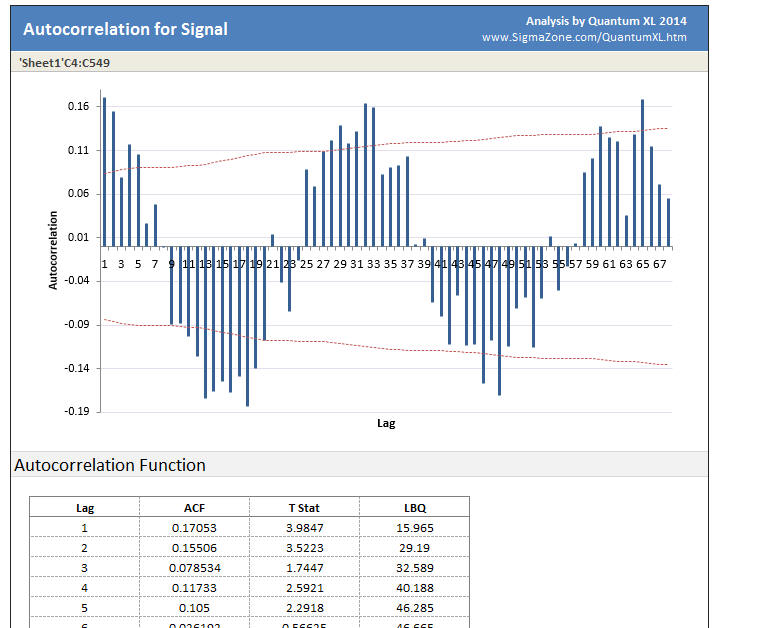
Plot Area: Quantum XL will plot the correlation vs. the lag. The dotted red lines are the 95% upper and lower significance limits. Any bars exceeding the red lines indicate a non-random effect.
Cross Correlation Function: Numerical analysis of the data.
ACF: Autocorrelation function -- Large positive or negative values indicate more correlation.
T Stat: The ACF divided by the standard error. Larger T Statistics indicate more significance.
LBQ: Ljung-Box Q statistic
Understanding Autocorrelation
Below is a line plot of the dataset used for the example above. It may be that the data is random or perhaps has a sinusoidal pattern which is being obscured by random variation.
The Autocorrelation analysis can help us answer this question. Below is the analysis; note the pattern that repeats itself on a period of about 15. This is a strong indication of Autocorrelation.
Compare that analysis with a different dataset. Below is a line plot of 1,000 numbers; is this data random or sinusoidal?
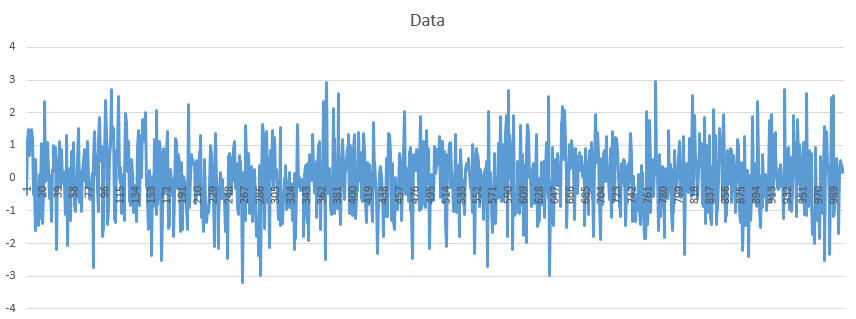
Autocorrelation Analysis of the data is below. Note that the sinusoidal pattern is missing. This data came from a random number generator and is not autocorrelated.