Home / Statistical Tools / Control Charts / Control Charts Data Sources
Control Chart Data Source
From Excel click...
QXL Stat Tools Tab > Control Charts
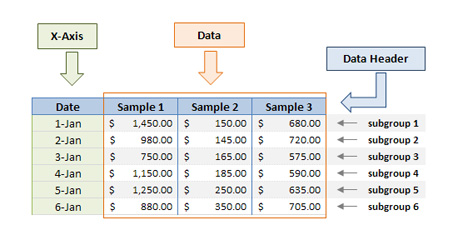
XbarR and XbarS chart
Data for the XbarR and XbarS chart can be in matrix or vector format.
| Matrix format, subgroups are in rows: | Matrix Format, subgroups are in columns: |
|---|---|
 |
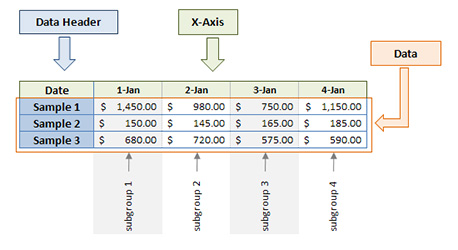 |
Quantum XL will try to detect orientation of the data. If it cannot be auto detected, you will be asked to choose the orientation.
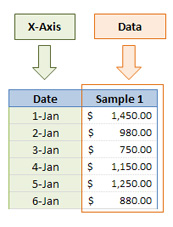
Vector format
For a vector format, data is in a single column or a single row. You have to provide the subgroup size in the options dialog when the data is in vector format. The minimum subgroup size is 2. The maximum is 100 or the number of data points, whichever is smaller.
IMR chart
Data for the IMR is in the vector format (single column, or a single row).
c Chart
c-Chart requires single data column or a single data row.
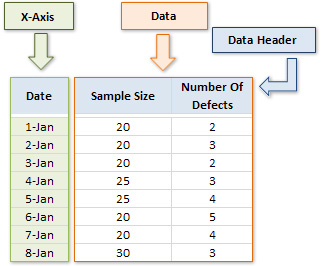
p, np and u Charts
p, np and u Charts require two data columns or two data rows.
The first column (row) represents sample size. The second column (row) is used for number of defects/defectives, depending on the chart.
If Sample size column is not provided, you can enter constant sample size in the text box. In that case only one column(row) is used for the data.