Home / Statistical Tools / Additional Tools / Decision Trees
Decision Trees
From Excel click...
QXL Stat Tools Tab > Additional Tools > Decision Trees
Decision Tree is a visual decision making tool where the Expected Value or Expected Cost of a decision is structured and evaluated.
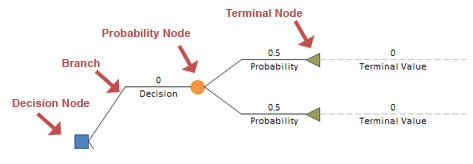
A Decision Tree consists of branches and 3 types of nodes:
| Symbol | Node Type |
|---|---|
 |
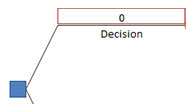
Decision Nodes |
 |
Probability Nodes |
 |
Terminal Nodes |
Decision and Probability nodes have one or more branches.
Creating Decision Tree
Step #1 - Create initial tree
Go to Quantum XL > Additional Tools > Decision Trees > Create Initial Tree. This will create a Decision Tree in a new worksheet.
Step #2 - Customize tree
After initial tree has been created, you can customize it by adding or removing elements. In order to customize the tree:
- Move mouse pointer over Decision Tree element (node or a branch)
- Left Click Decision Tree element
- Select option from pop-up menu
Below is the list of supported actions for each element.
| Element | Action |
|---|---|
| Decision Nodes | Add Branch - Add new Branch below the last branch for selected node. |
| Remove Node - Remove selected node and the entire sub-tree, and replace selected node with Terminal Node. | |
| Toggle Node - Change node to Probability Node. | |
| Probability Nodes | Add Branch - Add new Branch below the last branch for selected node. |
| Remove Node - Remove selected node and the entire sub-tree, and replace selected node with Terminal Node. | |
| Toggle Node - Change node to Decision Node. | |
| Terminal Nodes | Add Node - Change selected node to Probability Node and add two branches. |
| Insert Terminal Node - Insert new Terminal Node above currently selected Terminal Node. | |
| Remove Node - Remove Branch that ends with selected Terminal Node. | |
| Branches | Insert Branch - Insert new Branch above currently selected branch. |
| Remove Branch - Remove currently selected Branch. |
Running Monte Carlo simulations
One of the weaknesses associated with Risk Trees is a disagreement of the probabilities of each branch. Monte Carlo simulation can allow all voices to be heard by modeling a range of possibilities instead of a single scenario.
Step #1 - Set up Terminal Values
Enter values for all ending nodes. These values represent the impact or benefit of the selected path.
Step #2 - Set up probabilities, and mark inputs
Make sure that the sum of all probability values per probability node is equal to 1. Quantum XL sets all probability branches per node to be a function of a single probability value. For example, if there are two probability branches, Quantum XL will set the first one to some value, and the second one as a formula ( = 1 - FirstProbability ).
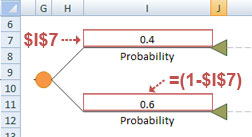
Mark probability value (one without formula) as Quantum XL input.
Step #3 - Mark Outputs
Mark Decision values as Quantum XL outputs.