Home / Tutorials / Pugh Tutorial
Pugh Decision Matrix Tutorial
This tutorial covers creating and using Pugh Decision Matrices for structured decision making. We will create a Decision Matrix for an Anti-Torque Device, part of a helicopter which provides flight stability.
Contents
- Step 1: Determine the decision criteria and collect alternatives
- Step 2: Create the Pugh Matrix using Quantum XL
- Step 3: Enter the decision criteria
- Step 4: Enter the weights for each decision criteria
- Step 5: Compare each of the alternatives to the baseline concept
Step 1: Determine the decision criteria and collect alternatives
The first step in creating a Pugh matrix is to brainstorm the evaluation criteria on which decisions should be based. If possible, customers should be involved in this process. Typically, criteria should include elements of Quality (includes performance), Cost, and Schedule.
For example, criteria for an Anti-Torque Device in a helicopter might be:
- Quality
- Cost
- Schedule
Step 2: Create the Pugh Matrix using Quantum XL
From Excel click...
QXL Stat Tools Tab > Pugh > Create Pugh Matrix
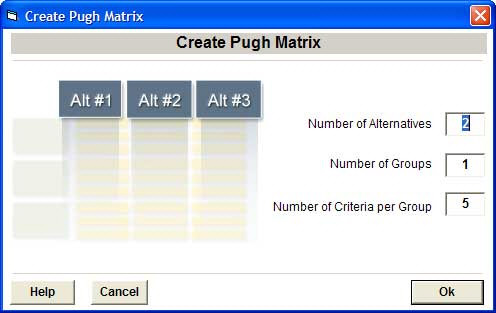
- Number of Alternatives: We have a baseline and two alternatives, so enter 2.
- Number of Groups: Enter a value of 3 for the three criteria groups: Quality, Cost and Schedule.
- Number of criteria: Enter a value of 4.
- Press Ok.
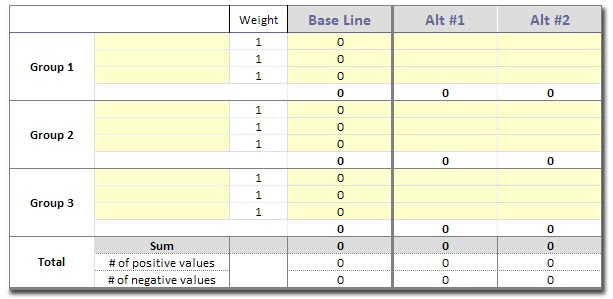
An empty Pugh Matrix will be generated and added to the current worksheet.
Step 3: Enter the decision criteria
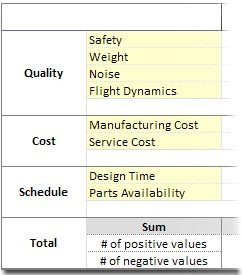
Enter the following into the matrix:
Group 1: Quality
- Safety
- Weight
- Noise
- Flight Characteristics
Group 2: Cost
- Manufacturing Cost
- Service Cost
Group 3: Schedule
- Design Time
- Parts Availability
Step 4: Enter the weights for each decision criteria
Weights allow you to scale the importance of decision criteria. For example, a weight of 4 is twice as important as a weight of 2. If you are in the very early stages, you can omit the weights or set all their values to 1.
Tips for setting weights:
- If you choose to use weights, agree on the scaling before you complete the remainder of the matrix.
- Use available data from the Identify phase, to include VOC and VOB data.
- Consider the group weights of Quality, Cost, and Schedule. The group weights are the sum of the criteria weights within a group. This ensures that a particular group will not tip the scale too far in one direction.
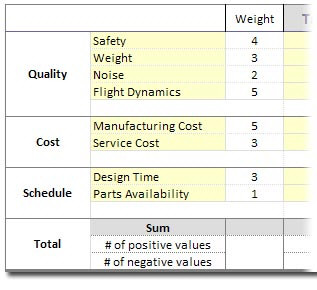
Completed Weights:
Step 5: Compare each of the alternatives to the baseline concept
First, you should pick a baseline design (leftmost column). The baseline is typically the current design or favored design. Ideally, the baseline design is a fall back position; if the new design fails for any reason, you can always go back to the old design.
Compare the design alternatives using the following scale:
| Score | Meaning |
|---|---|
| +3 | Far Better than Baseline |
| +2 | Much Better than Baseline |
| +1 | Better than Baseline |
| 0 | Same as Baseline |
| -1 | Worse than Baseline |
| -2 | Much Worse than Baseline |
| -3 | Far Worse than Baseline |
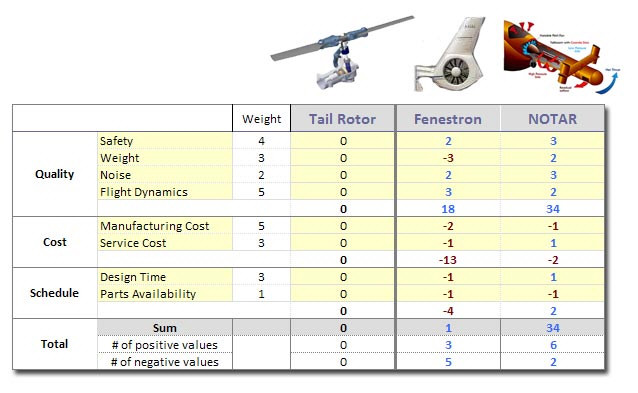
The matrix automatically calculates weighted scores for each alternative, making it easy to identify the best design choice based on your criteria.